How to Use Behavior Tracking Charts: In this article, you will learn how to use a behavior chart at home or in the classroom. We will cover two simple tools: the ABC chart and the scatterplot graph, which can help you understand, track, and respond to challenging behavior.
Toys flushed down the toilet. Books torn. Dolls broken. Tantrums that seem to come out of nowhere.
Have you ever felt so overwhelmed by your child’s behavior that you turned to a professional for help? I have. And honestly, I was a little disappointed when all my carefully described horror stories didn’t lead to a magic solution.
Instead, I was sent home with some homework: behavior charts. More specifically, I was told to start tracking behavior with an ABC chart.
It’s been years since that first visit to the psychologist, and I’ve tracked many behaviors since then. Different issues have come up at different stages, and over time, I’ve learned to approach behavior tracking with more confidence. It probably helps that I later earned a degree in Psychology and went on to study challenging behavior in depth.
Today, I want to share two simple behavior charts that may help you make sense of what’s happening at home. If you’re navigating behavior challenges, these tools can give you clarity and direction.
But first, let’s clear something up.
When most people hear “behavior chart,” they think of reward charts, like sticker charts, token boards, or systems where kids earn points or prizes for good behavior. Those can be helpful tools too, but that’s not what this post is about.
Here, we’re talking about tracking charts. These are tools that help you figure out why a behavior is happening. They are used to gather information, not to motivate behavior directly. Think of them as detective tools. They help you spot patterns, identify triggers, and make more informed decisions, whether on your own or with a professional’s help.
Related Resource: How To Use a Reward System Effectively (Reward Chart)
Now that we’re clear on what kind of chart we’re talking about, let me tell you why I’ve found them so useful.
Why do I find behavior charts helpful as a parent?
- They help you make educated guesses about why certain behaviors happen.
- They give you specific, measurable information — so if you do seek help, you’ll be bringing valuable data with you.
- They keep things objective. You’re not relying on memory or emotions.
- They give you a sense of control. Instead of feeling stuck, you’re actively gathering information that can guide your next steps.
Important note: Nothing you read on the internet, including this post, can replace professional guidance. If your child is experiencing serious behavior challenges, be sure to speak with your doctor or a qualified specialist.
Behavior Tracking Charts You Can Use at Home or in the Classroom
ABC Behavior Charts: Understand the Why Behind the Behavior
You may have shared countless stories with your therapist, thinking you’ve painted the full picture of what’s going on at home. But even with all that detail, something is still missing. To truly understand behavior, both your therapist and you need more than anecdotes. You need data.
That’s where tracking charts come in.
Let me help you save some time, energy, and maybe even a few therapy sessions. By learning how to track behavior using the right tools, you can start making sense of what’s really going on. And this information will also be useful to a professional if you decide to seek support later on.
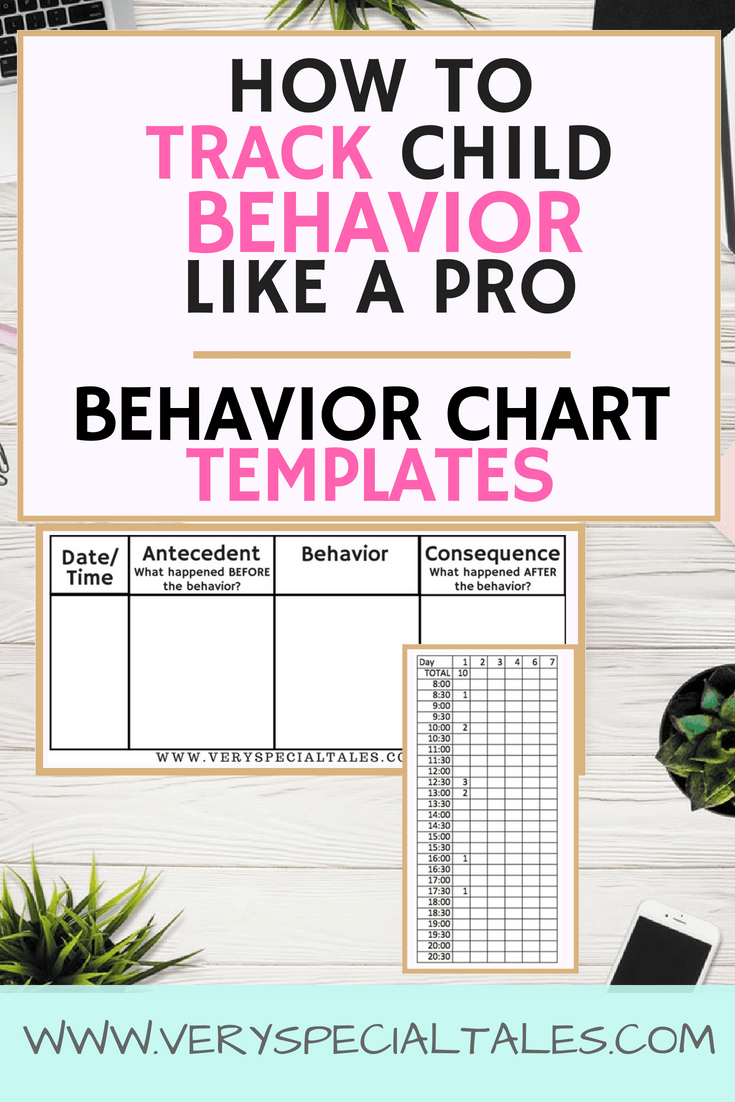
What is an ABC Chart?
An ABC chart is a simple tool used to observe and record what happens before, during, and after a behavior. The letters stand for:
- A = Antecedent (what happened right before the behavior)
- B = Behavior (what the child did)
- C = Consequence (what happened right after the behavior)
This kind of observation helps you gather two key pieces of information:
- What might be triggering the behavior
- What might be reinforcing it (in other words, what happens afterward that makes it more likely to happen again)
Keep in mind that ABC charts help you make an educated guess, or what psychologists call a hypothesis. They help you spot patterns, but they don’t prove cause and effect. In research terms, you are identifying correlations, not causes.
Here’s what a basic ABC tracking sheet looks like:

How to Fill Out an ABC Chart
To get meaningful insights from your ABC chart, you’ll need to record each incident with some level of detail. Here’s what to include under each section:
A = Antecedent
What happened right before the behavior occurred?
Ask yourself:
- Where was the child?
- Who else was present?
- What was each person doing at the time? (siblings, parents, teacher, etc.)
- Was there a specific demand or instruction given?
B = Behavior
What exactly did the child do?
Be specific. Avoid general terms like “misbehaved” and describe the behavior clearly. For example:
- Vocalizations (e.g., talked loudly, shouted)
- Verbal aggression (e.g., swore, insulted)
- Physical aggression (e.g., hit, kicked)
- Self-injurious behavior (e.g,. headbanging, self-biting)
C = Consequence
What happened immediately after the behavior?
This includes everyone’s response to the behavior, not just the child’s. Consider:
- What did the adults or other children do or say?
- Did the child receive attention? (Even being told off is a form of attention.)
- Did the child get access to something they wanted?
- Did the behavior allow the child to avoid or escape an activity?
Write down what you did, what others in the room did, and how the situation unfolded right after the behavior occurred.
ABC Chart Examples
Here are a couple of examples to show what an ABC record might look like in practice:
Example 1
- Antecedent: The whole family is in the living room. Mom is reading the news on her phone. Sister is watching Minnie Mouse. Brother is not really engaged and doesn’t enjoy the show.
- Behavior: Brother takes one of Sister’s toys and flushes it down the toilet.
- Consequence: Everyone reacts. Sister gets upset. Mom puts her phone down, lectures Brother, and asks him to apologize. She explains why that behavior is not okay. Everyone is now focused on him and talking to him.
Example 2
- Antecedent: Mom is talking to Sister and complimenting her for a nice drawing.
- Behavior: Brother begins throwing toys on the floor.
- Consequence: Mom stops talking to Sister and turns her attention to Brother, asking him to stop and behave.
What to Do with This Information
For a few days, try tracking a handful of behavior episodes using this format. Your goal is not just to create a list of incidents, but to start spotting patterns:
- When do these behaviors happen?
- What tends to trigger them?
- How do others respond, and could those responses be reinforcing the behavior?
This kind of “field work” helps you build a clearer picture of what’s going on and puts you in a better position to create a plan that fits your specific situation.
Want to start tracking today?
You can download the free ABC behavior chart template I’ve included at the end of this post.
Using a Scatterplot Graph
Sometimes, challenging behaviors don’t just happen randomly. They tend to cluster around certain times of day or specific routines. But when these behaviors are scattered throughout the day, it’s easy to overlook patterns or miss what’s actually triggering them.
Let me share a personal example.
A few years ago, just after we relocated to a new city, I used to pick up my son from school a couple of hours before collecting my daughter. We often had a calm and enjoyable time together, reading books or watching children’s songs online. But each day, as soon as we parked outside my daughter’s school, things would suddenly take a turn.
Looking back, it seems obvious that the shift from “one-on-one time with Mum” to “sharing attention with his sister” was upsetting for him. But at the time, it didn’t stand out because challenging behaviors also happened in other situations. It was easy to miss that specific transition as a consistent trigger.
When to Use a Scatterplot Graph
If a behavior is happening frequently, you may want to track:
- How often it occurs
- When it tends to spike (specific times, transitions, activities, or settings)
A scatterplot chart helps you do exactly that. In this type of behavior chart, you break the day into half-hour blocks. Then, across several days, you note how many times the target behavior occurs in each time slot.
For example, you might notice outbursts happening more often in the 5:00–5:30 window, right before dinner, or during transitions like packing up at school.
You can either:
- Write the number of times the behavior happened, or
- Shade the box if it occurred two or more times in that time slot.
Personally, I like to write the exact number. It gives a clearer picture of frequency and helps track changes more accurately over time.
Over time, this creates a visual map that helps you identify patterns you may not have seen before.

How a Scatterplot Chart Helped Me Understand and Improve Behavior
In the example I shared earlier, using the scatterplot chart helped me spot a pattern I hadn’t noticed before. I realized that the most difficult moments were happening right at the transition from one-on-one time with me to picking up my daughter from school.
Once I understood that this specific transition was a trigger, I was able to take some simple steps to help my son handle it more smoothly. Here’s what I did:
- While still in the car, I would say something kind or reassuring to help him feel connected.
- As he stepped out of the car, I gave him a big hug.
- As we walked into the school, I would talk about something interesting or fun to shift his focus and ease the transition.
These small changes made a big difference in how he coped with that part of the day.
Tips for Tracking Behavior and Data Collection
Here are a few practical tips to help you use behavior charts effectively at home or in the classroom:
- Keep your charts visible and easy to access.
Place your ABC chart or scatterplot chart somewhere you can quickly jot down notes as things happen. - Look for patterns in your data.
Ask yourself:- Are there certain times, places, or activities when the behavior is more likely to happen?
- Is the behavior more common with specific people or during certain transitions?
- Think about what’s reinforcing the behavior.
What is the child getting out of it?- Attention (even being told off counts)
- A desired item or activity
- A way to avoid or escape something unpleasant
- Use this information to make a plan.
Once you start seeing patterns, you can:- Adjust routines, expectations, or the environment
- Teach a replacement behavior that helps the child meet their need in a more appropriate way
- Share the information with a professional if you’re seeking outside support
One Last Thing…
Now for the good news and the not-so-easy news.
The good news is that things can get better. You’ll gain insight, make changes, and begin to feel more confident and in control.
The harder part? In my experience, this is more of a marathon than a sprint. It takes patience, consistency, and a lot of effort. And just when it feels like you’ve made real progress, things might go off track again.
That doesn’t mean you’re doing anything wrong. It just means the work continues, and that you’re not alone in facing these ups and downs.
Explore Other Behavior Resources
- Teen behavior contract templates (for younger kids too!)
- How to Use Rewards for Kids Effectively
- 101 Reward Ideas for Kids
- Impulse Control Strategies for Kids
- Anger Management Activities for Kids
- Anger Management Activities for Teens
- Family Rules: Why and How
- Behavior Problems in Children: Reasons Why A Child May Be Misbehaving
Behavior Chart Templates (Free PDF Download)
Download your behavior chart templates below:
I hope you found this post useful. If so, share us on Pinterest ♥:
![]()


ABC chart seems to be usefull. Will also comment after trying this chart.